Three Phylogeography Tools - SpreaD3, SERAPHIM, and PhyloGeoTool
Phylogeography combines phylogenetics and geography to investigate how genetic lineages spread across regions over time. By integrating genetic, geographic, and epidemiological data, researchers can answer critical questions about pathogen origins, transmission routes, and the factors influencing their spread. This approach has been transformative for tracking infectious diseases like COVID-19, influenza, and HIV.
The tools we’ll explore—SpreaD3, SERAPHIM, and PhyloGeoTool—each tackle different challenges in phylogeographic analysis, from creating compelling visualizations to performing deep statistical analyses.
1. SpreaD3: Visualizing Pathogen Spread
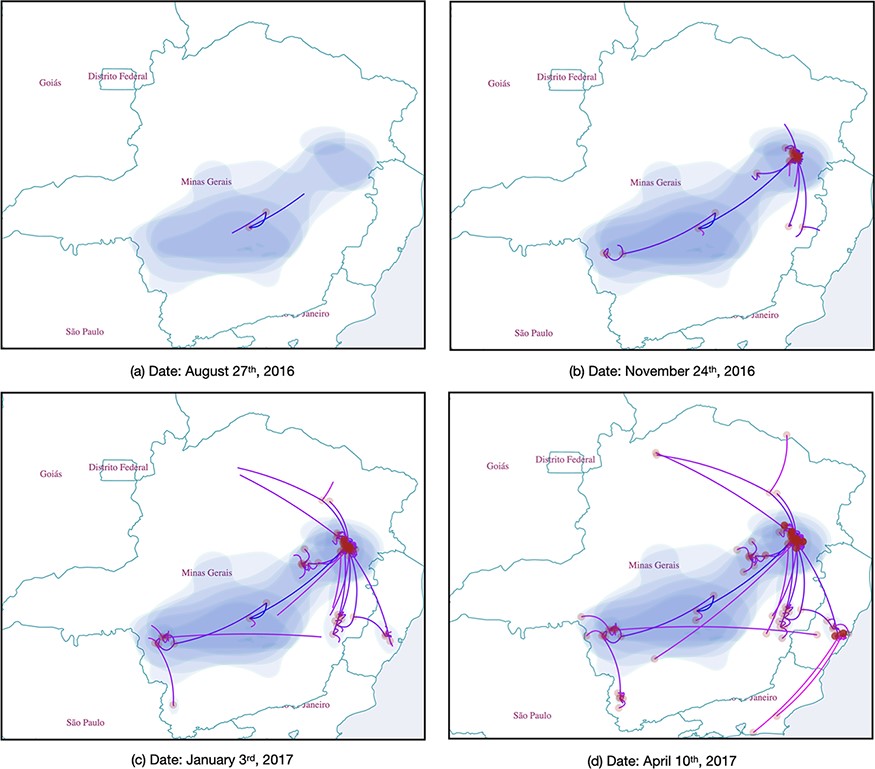
If you’ve ever wondered what it looks like to watch a virus spread in real-time—crossing borders, adapting to new hosts, or taking hold in a new continent—SpreaD3 is the tool for the job. It creates dynamic animations that show genetic lineages moving through space and time, making it an invaluable tool for researchers and policymakers alike.
Developed as a successor to SpreaD2, this Java-based application works seamlessly with BEAST or BEAST2, which are commonly used for evolutionary analyses. By loading time-stamped phylogenetic trees and metadata into SpreaD3, you can visualize how a pathogen like SARS-CoV-2 or Zika virus might have traveled from one region to another.

SpreaD3 can generate:
- Interactive globe visualizations showing transmission routes as curved lines between locations
- Time-slider controls that let users scrub through different periods of an outbreak
- Heat maps showing the intensity of transmission events in different regions
- Custom-colored lineages that track specific viral variants or strains
Why Use SpreaD3?
- It’s perfect for creating visually compelling animations of how lineages evolve and spread
- Great for teaching, policy briefings, and presentations
- Offers intuitive tools for researchers who don’t want to dive into scripting
2. SERAPHIM: Spatiotemporal Analysis in R
While SpreaD3 focuses on creating polished visuals, SERAPHIM is all about flexibility and statistical depth. Designed for researchers who are comfortable with coding in R, SERAPHIM allows you to process and analyze phylogeographic data from tools like BEAST in a reproducible, scriptable environment.
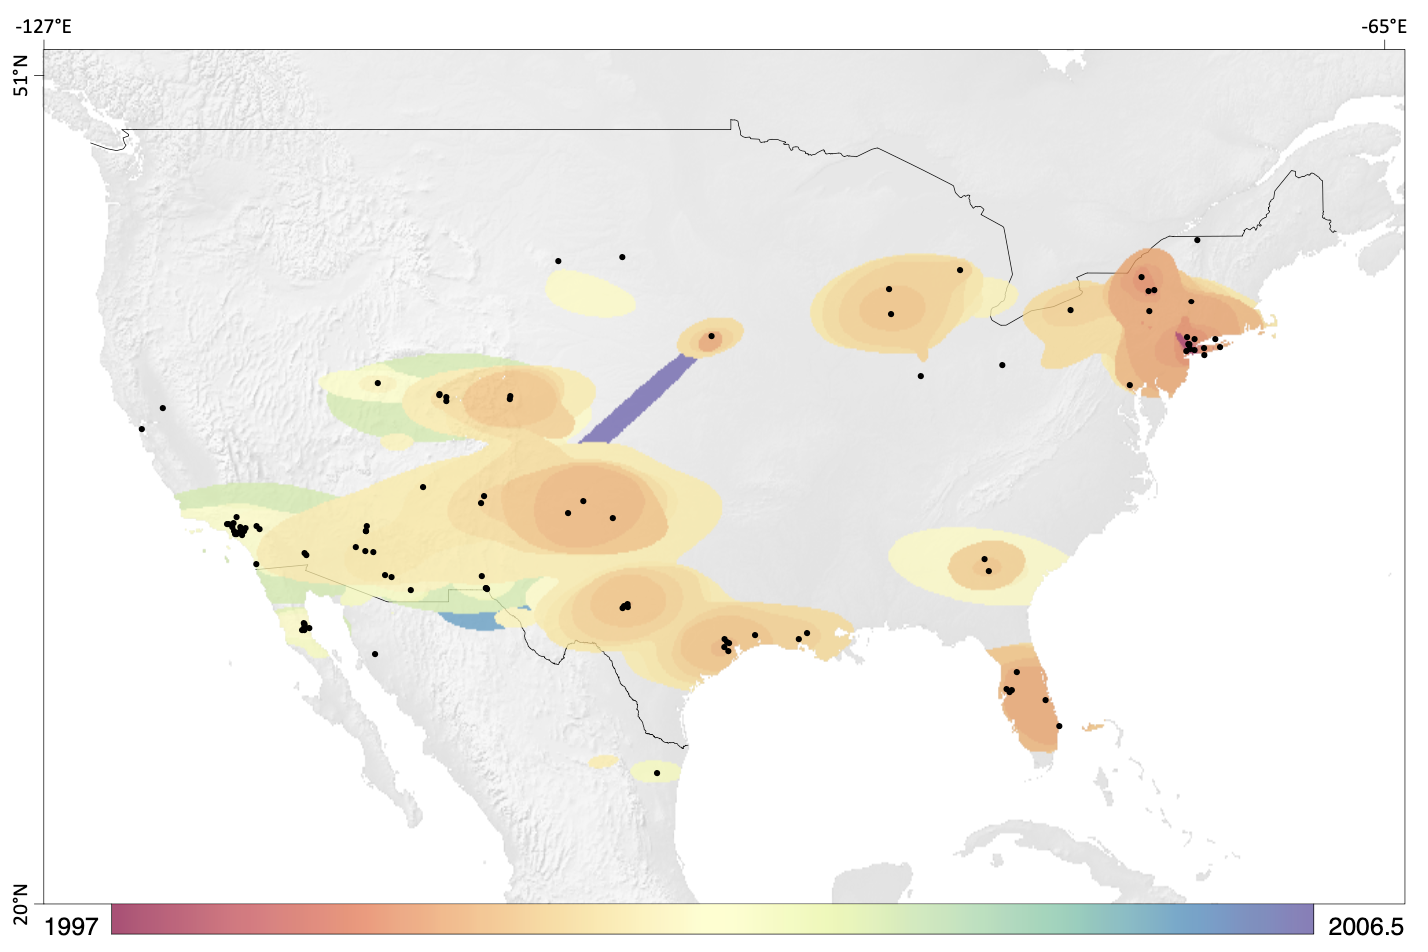
What makes SERAPHIM special is its ability to handle large, complex datasets and integrate them into R workflows. For example, it can extract detailed statistical summaries from phylogenetic trees, map dispersal trajectories on geographic plots, and allow researchers to apply custom statistical models.

SERAPHIM can produce:
- Detailed dispersal velocity matrices showing how quickly pathogens move between regions
- Environmental factor correlation analyses linking spread patterns to climate data
- Custom ggplot2-based visualizations combining multiple data layers
- Statistical summaries of spatial spread patterns over time
Why Use SERAPHIM?
- Perfect for researchers who want full control over their analyses
- Ideal for reproducibility and integration with broader R workflows
- Best for advanced statistical exploration of phylogeographic patterns
3. PhyloGeoTool: Connecting Genetics and Geography
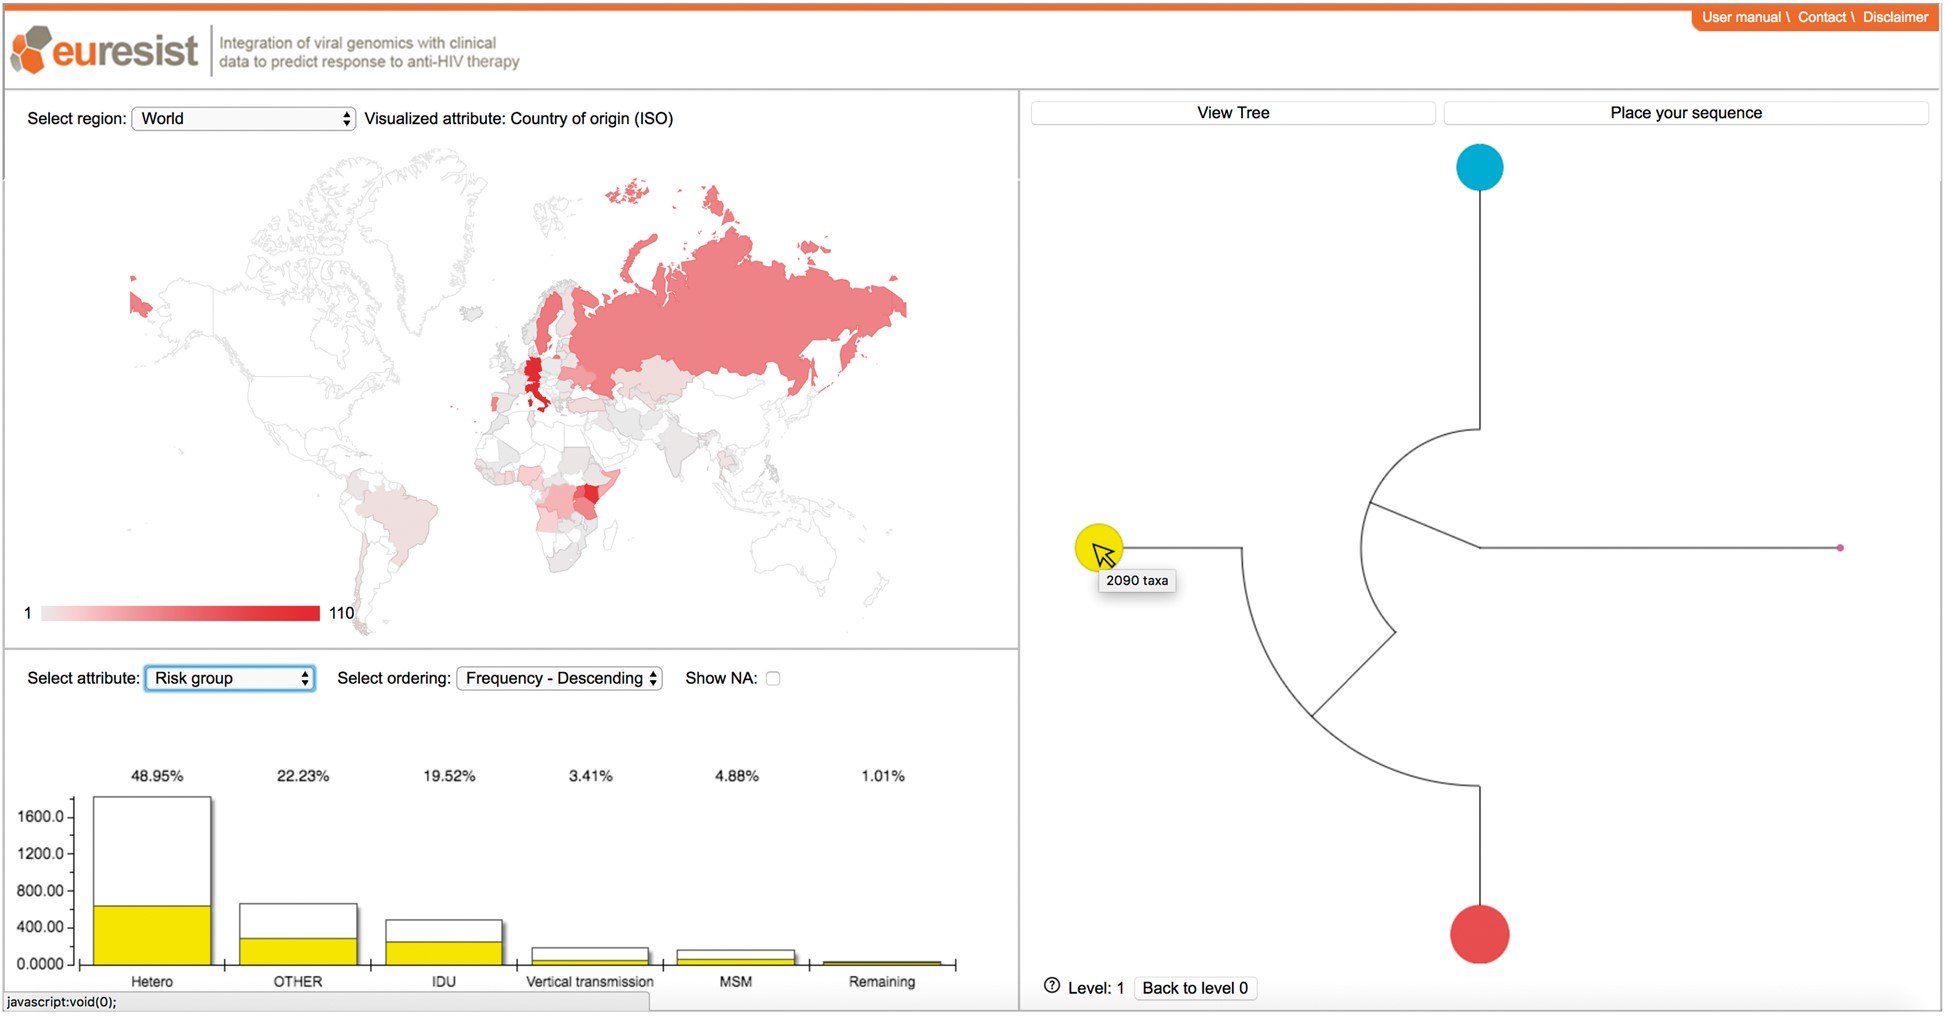
PhyloGeoTool bridges the gap between phylogenetics and epidemiology, making it particularly useful for public health applications. Imagine you’re studying drug-resistant HIV strains in Europe and want to understand how they spread across different regions. PhyloGeoTool doesn’t just show you where the strains are—it also clusters your phylogenetic data, integrating geographic and epidemiological metadata to identify trends.

PhyloGeoTool generates:
- Interactive cluster visualizations showing genetic similarity between samples
- Geographic heat maps of strain distribution
- Demographic summaries linked to genetic clusters
- Custom reports combining phylogenetic and epidemiological data
Why Use PhyloGeoTool?
- Ideal for large-scale datasets where clustering and metadata integration are crucial
- Strong focus on epidemiological and public health applications
- Combines genetic and geographic information in an intuitive way
Comparing the Three Tools
| Aspect | SpreaD3 | SERAPHIM | PhyloGeoTool |
|---|---|---|---|
| Platform | Java application | R-based pipeline | Java-based tool (some versions may have web/GUI components) |
| Primary Output | Dynamic, time-lapse animations of pathogen spread | Statistical summaries & R-based visualizations | Geographic clustering + metadata integration |
| Integration with BEAST | Directly reads BEAST(X) output files (GUI-based workflow) | Reads/post-processes BEAST outputs in R | Integrates phylogenetic data with metadata; multiple formats |
| Programming Skills | Minimal (graphical interface) | Intermediate (R scripting) | Minimal to moderate (depends on advanced custom analyses) |
| Focus | Interactive visual storytelling | Reproducible, script-driven spatiotemporal analysis | Geographic clustering, public health/epidemiology context |
| Typical Use | Presentations, teaching, outbreak mapping | Statistical exploration, advanced research workflows | Large-scale studies of pathogen spread (e.g., HIV, influenza) |
Key Takeaways
The evolution of phylogeographic tools reflects the growing sophistication of how we track and understand pathogen spread. Together, these tools create a comprehensive ecosystem for different aspects of spatial-temporal analysis:
- Visual Communication: SpreaD3’s animations have revolutionized how we communicate complex transmission patterns to diverse audiences, from scientists to policymakers.
- Statistical Rigor: SERAPHIM’s integration with R has enabled more sophisticated hypothesis testing about factors influencing pathogen spread.
- Clinical Impact: PhyloGeoTool’s focus on connecting genetic and epidemiological data has strengthened the bridge between research findings and public health action.
As emerging infectious diseases continue to challenge global health systems, these tools will play an increasingly crucial role in understanding and responding to outbreaks.
References & Further Reading
- SpreaD3: Bielejec F, Baele G, Vrancken B, et al. (2016). SpreaD3: Interactive Visualization of Spatiotemporal History and Trait Evolutionary Processes. Mol Biol Evol, 33(8): 2167–2169.
- SERAPHIM: Dellicour S, Rose R, Faria NR, et al. (2016). SERAPHIM: An R pipeline for the spatiotemporal reconstruction of epidemic dynamics from viral genealogies. BMC Bioinformatics, 17(Suppl 14): 304.
- PhyloGeoTool: Libin P, Deforche K, et al. (2019). PhyloGeoTool: Interactive Phylogeographic Analysis for Infectious Disease Spread. Virus Evolution, 5(1).
Enjoy Reading This Article?
Here are some more articles you might like to read next: